Is Firefox currently losing many users?
Spoiler: Actually not. Why many browser-statistics are misleading
When I look around my circle of friends, I see many fiercely loyal Firefox users, who won’t drop Firefox as long as it works. Who put in effort to keep using it. But its market share statistics are dwindling.
Do I have to accept that my friends are outliers, or could there be a different explanation?
Update 2024: In 2022 Firefox started loosing more users. Not 50 Million per year as before 2016, but the monthly active users have been shrinking by 10-15 million per year since 2022 — from 205 million peak in 2020 to 171 million peak in 2024. 🫤
Let’s look into the data. We’ll start with the misleading statistics from Wikipedia: User share of web browsers; plotting that ourselves using the csv-data from statcounter browser-market-share:
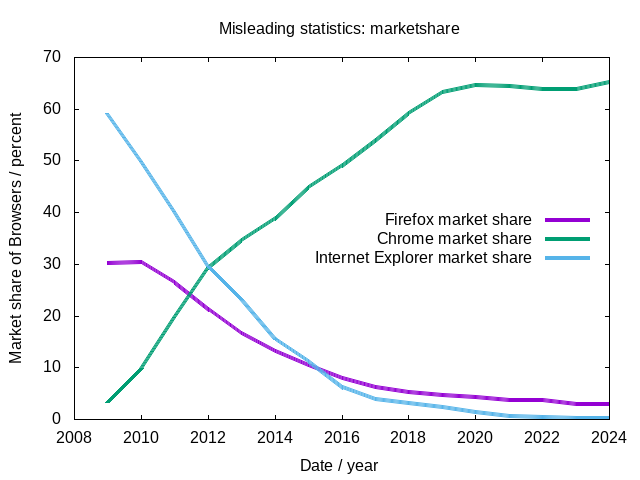

That looks pretty clear,1 and it is what almost every news site shows you. But it is relative — does it actually tell us something about user count?
We’ll need reference data: How many internet users are there? Luckily there is data on that by the ITU:
- ITU_regional_global_Key_ICT_indicator_aggregates_Nov_2023.xlsx — which fraction of the population has internet? More specifically the table “Individuals using the Internet”.
So now all we need to do is to scale the browser statistics graph with each years number of people with Internet.
First we open the ITU file with libreoffice and export it as CSV file. After selecting only “Individuals using the Internet” (the relevant part) and removing thousand-separators from numbers, this gives us millions of people. To ease reading of this article, the data is in the appendix.
Then we get the exported data from the browser statistics from statcounter browser-market-share: browser-ww-yearly-2009-2024.csv.
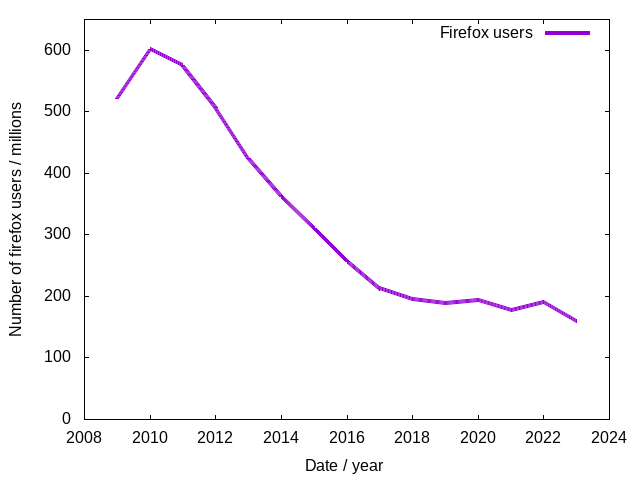
Now all we need to do is to merge these and plot the result with gnuplot:
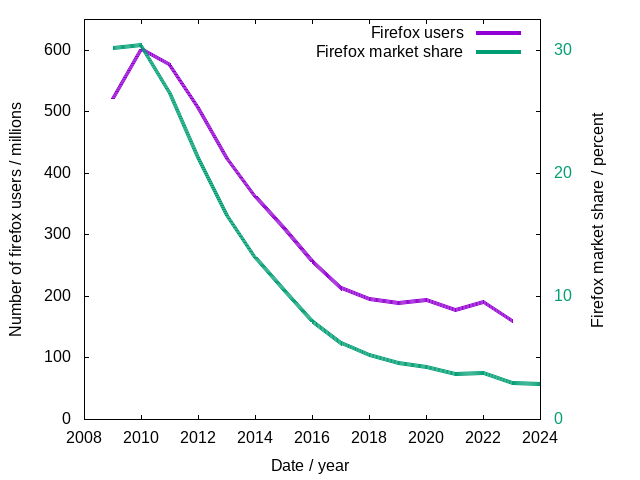
That does not look as enigmatic as before: Compared to the time when Firefox was the one browser that challenged the atrocity that was (and is) Internet Explorer, Firefox lost about two third of its users, but now its user count seems to have stabilized.
Comparing that to the Public Data Report by Mozilla shows a pretty good match: About 200 Million users, mostly stable.
So why do many browser stats look so awful?
Let’s add the numbers of internet users all over the world to the diagram (thank you, ITU!):
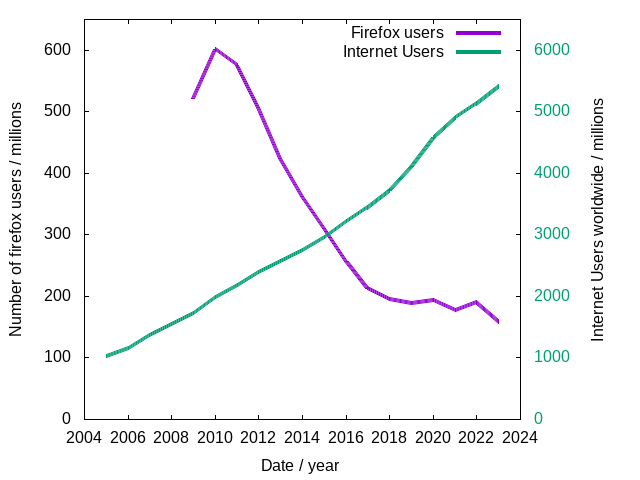
In the time since Firefox was the only alternative to IE, the number of internet users increased by factor 4. But why did Firefox not manage to get them as users?
Let’s also look at the browsers bundled with most mobile phones and tablets:
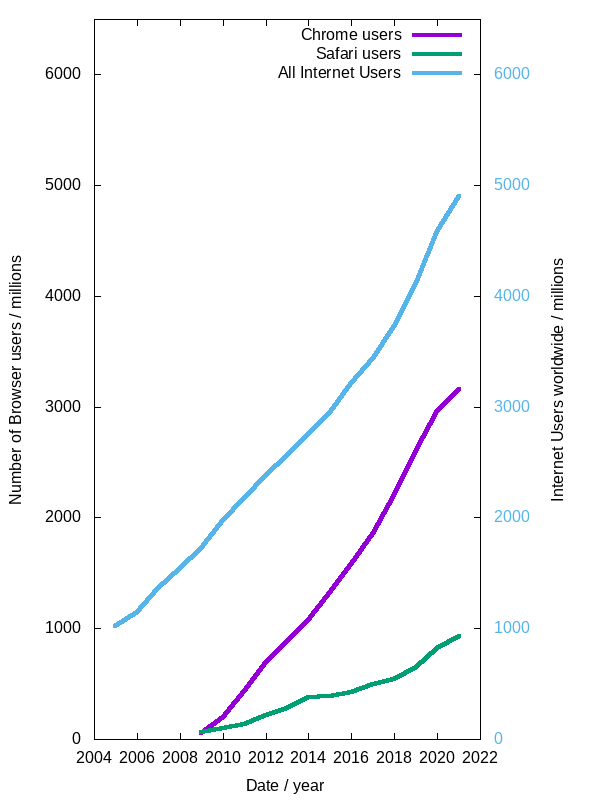
So the market share we see shows that while Firefox might not have lost as many old users as the market share would suggest, it did not manage to reach many of the new users on mobile platforms. But many Firefox users stayed Firefox users and over the past 5 years user count mostly stabilized.
When I saw that, it caused a major shift in my perception of browsers: What we’re seeing is not mainly the effect of failures by Firefox, but rather of anti-competitive bundling of browsers on mobile platforms.
Because on mobile Firefox is almost non-existent, even though it does provide decent support nowadays.
Let’s look at data one last time: browsers on mobile:
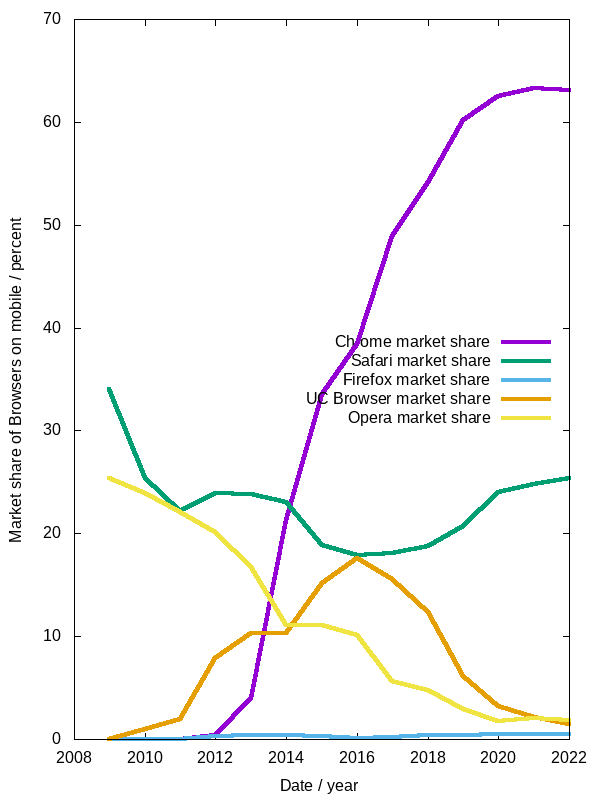
Safari and Chrome are the browsers bundled with most mobile phones. This should make it pretty clear that only the browsers bundled with the phones have decent market share while all others are losing it, even if they started strong like Opera or got some temporary foothold like UC Browser. So this is clearly a bundling issue.
The one opportunity Mozilla really missed might have been Firefox OS, abandoned in 2015 (but still in use on some TVs and lots of small phones today, see KaiOS). That would have played the bundling game, but that should not be required on open platforms. And this openness of platforms is what is missing.
In 1998, Microsoft was sued for violating antitrust laws, but could settle in 2001 to only provide its API to others, and in 2010 Microsoft was forced to offer alternative browsers in Windows in the EU, but this turned out to benefit Chrome the most.
Still, these statistics show that it is high time anti-trust actions are pulled on mobile.
And if you’re a web developer and you are tempted to drop Firefox support, then keep in mind that that might just cost you those of your users with the highest loyalty — the ones you want to lose the least, because they are the ones most likely to stick with you even if a hip, new, VC-crammed competitor comes around and tries to disrupt you.
Those 200 million users may not be the largest group of internet users, but they are 200 million, and they decided to stick to Firefox again and again in the past decade against many kinds of anti-competitive actions.
And beware of using the wrong statistical measure to take decisions: different from the market share, the Firefox user count stabilized in the past years.
Appendix
Data: Internet users by year and region
Selecting only “Individuals using the Internet” (the relevant part) and removing thousand-separators from numbers, this gives us millions of people.
See https://www.itu.int/en/ITU-D/Statistics/Pages/stat/default.aspx — specifically: ITU_regional_global_Key_ICT_indicator_aggregates_Nov_2023.xlsx
Year,2005,2006,2007,2008,2009,2010,2011,2012,2013,2014,2015,2016,2017,2018,2019,2020,2021,2022,2023
World,1023,1147,1367,1545,1727,1981,2174,2387,2562,2750,2954,3217,3444,3729,4119,4585,4914,5132,5417
Developped,616,650,723,754,778,826,844,900,927,952,968,1026,1046,1077,1104,1123,1136,1147,1164
Developing,408,496,645,791,949,1155,1330,1487,1635,1798,1986,2192,2398,2652,3015,3521,3778,3985,4253
Least Developed Countries (LDCs),6,8,15,14,19,24,31,39,50,76,98,134,165,202,232,288,324,360,407
Land Locked Developing Countries (LLDCs),7,10,13,17,23,32,41,51,62,73,91,103,118,134,153,172,180,202,226
Small Island Developing States (SIDS),8,9,11,13,14,16,18,20,23,24,27,30,34,37,39,38,39,40,41
Low-income, Lower-middle-income, and Upper-middle-income added together, because these were all grouped as “developing” in the report from 2021.
Data: market share
Then we get the exported data from the browser statistics from statcounter browser-market-share: browser-ww-yearly-2009-2024.csv.
By StatCounter - https://gs.statcounter.com/browser-market-share#yearly-2009-2024, CC BY-SA 3.0, https://commons.wikimedia.org/w/index.php?curid=96191474
Year,Chrome,IE,Firefox,Safari,Opera,Android,UC Browser,Samsung Internet,Edge Legacy,Nokia,BlackBerry,IEMobile,Edge,NetFront,Yandex Browser,360 Safe Browser,Maxthon,QQ Browser,Sogou Explorer,Sony PS3,Chromium,Silk,Unknown,Coc Coc,Mozilla,Puffin,KaiOS,Dolfin,Sony PS4,Samsung,AOL,SeaMonkey,Openwave,Phantom,Whale Browser,SonyEricsson,Pale Moon,Obigo,Jasmine,Other
2009,3.23,59.1,30.17,3.41,2.85,0.02,0,0,0,0.19,0.08,0.01,0,0.03,0,0,0.03,0,0,0.12,0,0,0,0,0.32,0,0,0,0,0,0.2,0.03,0.02,0,0,0.01,0,0,0,0.17
2010,9.95,49.93,30.35,4.93,2.6,0.27,0.03,0,0,0.48,0.48,0.01,0,0.1,0,0,0.21,0,0,0.14,0,0,0.01,0,0.14,0,0,0,0,0.03,0.1,0.03,0.02,0,0,0.01,0,0,0,0.19
2011,19.79,40.31,26.49,6.36,3.08,1.16,0.12,0,0,0.94,0.7,0.02,0,0.21,0,0,0.14,0,0,0.14,0.04,0,0.02,0,0.04,0,0,0.04,0,0.05,0.02,0.02,0.02,0,0,0.02,0,0.04,0.03,0.19
2012,29.3,29.66,21.27,9.04,3.67,2.89,0.85,0,0,1.14,0.55,0.07,0,0.4,0,0.11,0.11,0.02,0.05,0.1,0.07,0.06,0.04,0,0.01,0,0,0.13,0,0.06,0,0.03,0.01,0.01,0,0.02,0.02,0.04,0.04,0.23
2013,34.67,23.15,16.55,10.94,3.68,5.37,1.68,0,0,1.12,0.53,0.25,0,0.39,0.22,0.21,0.16,0.05,0.13,0.09,0.06,0.14,0.08,0,0.01,0.03,0,0.08,0,0.04,0,0.02,0.02,0.03,0,0.01,0.03,0.02,0.02,0.21
2014,38.94,15.46,13.17,13.77,4,7.23,2.83,0,0,1.09,0.43,0.62,0,0.38,0.24,0.44,0.17,0.11,0.13,0.05,0.07,0.17,0.13,0.03,0.02,0.06,0,0.07,0.01,0.02,0,0.01,0.04,0.03,0,0.02,0.02,0.01,0.01,0.22
2015,44.87,11.24,10.51,13.06,5,6.31,5.37,0,0.28,0.42,0.34,0.73,0,0.15,0.28,0.18,0.15,0.16,0.13,0.02,0.09,0.12,0.09,0.07,0.02,0.05,0,0.04,0.04,0.01,0,0.02,0.02,0.03,0,0.02,0.02,0.01,0.01,0.19
2016,49.08,6.25,7.97,13.31,5.47,3.96,7.77,2.33,1.42,0.11,0.26,0.62,0,0.07,0.28,0.09,0.1,0.09,0.08,0.01,0.08,0.01,0.07,0.14,0.02,0.07,0,0.02,0.07,0,0,0.01,0.01,0.03,0,0.02,0.02,0,0,0.15
2017,53.96,3.95,6.19,14.51,3.84,2.39,8.25,3.3,1.85,0.07,0.13,0.34,0,0.02,0.27,0.05,0.06,0.12,0.07,0.01,0.07,0,0.04,0.13,0.02,0.06,0,0.01,0.09,0,0,0.01,0,0.03,0,0.01,0.01,0,0,0.14
2018,59.12,3,5.21,14.43,3.52,1.49,6.66,2.77,1.95,0.04,0.05,0.17,0,0.01,0.25,0.03,0.05,0.28,0.06,0.01,0.07,0,0.03,0.11,0.02,0.09,0.33,0,0.07,0,0,0.01,0,0.02,0.01,0.01,0.01,0,0,0.13
2019,63.31,2.24,4.57,15.86,2.57,0.86,3.3,3.45,2.14,0.01,0.02,0.08,0,0,0.25,0.02,0.04,0.25,0.06,0,0.08,0,0.02,0.12,0.04,0.13,0.35,0,0.06,0,0,0,0,0,0.07,0,0.01,0,0,0.1
2020,64.6,1.35,4.22,17.84,1.99,0.51,1.74,3.35,1.38,0,0.01,0.02,1.45,0,0.26,0.25,0.03,0.28,0.06,0,0.04,0,0.02,0.09,0.09,0.12,0.08,0,0.05,0,0,0,0,0,0.11,0,0.01,0,0,0.03
2021,64.45,0.62,3.62,18.9,2.24,0.62,1.21,3.11,0.22,0,0,0,3.59,0,0.24,0.29,0.02,0.26,0.05,0,0.02,0,0.02,0.04,0.08,0.08,0.08,0,0.04,0,0,0,0,0,0.12,0,0.01,0,0,0.02
2022,63.88,0.47,3.71,19.25,2.21,0.68,0.84,2.84,0.15,0,0,0,4.06,0,0.23,0.24,0.01,0.23,0.05,0,0.02,0,0.02,0.06,0.08,0.08,0.08,0,0.03,0,0,0,0,0,0.11,0,0.01,0,0,0.67
2023,63.87,0.21,2.95,19.78,2.74,0.62,0.89,2.48,5.03,0.05,0,0,0.01,0.26,0,0.26,0.24,0.01,0.03,0,0.16,0.01,0.01,0,0.07,0.05,0.07,0,0.02,0,0.1,0,0,0,0,0,0.04,0,0,0,0.03
2024,65.19,0.16,2.88,18.36,2.37,0.52,0.94,2.6,5.21,0.03,0,0,0,0.36,0,0.39,0.44,0,0.04,0,0.12,0.01,0.02,0,0.04,0.02,0.07,0,0.01,0,0.12,0,0,0,0,0,0.04,0,0,0,0.04
Browsers on mobile
By StatCounter - https://gs.statcounter.com/browser-market-share#yearly-2009-2024, CC BY-SA 3.0, https://commons.wikimedia.org/w/index.php?curid=96191474
Year,Chrome,Safari,UC Browser,Android,Opera,Samsung Internet,Nokia,BlackBerry,IEMobile,NetFront,Firefox,QQ Browser,Unknown,KaiOS,Dolfin,Puffin,Samsung,Edge Legacy,Yandex Browser,Openwave,SonyEricsson,Obigo,Jasmine,Whale Browser,Instabridge,Sony PSP,Tizen,Phantom,Baidu Browser,Sony PSP Vita,MeeGo,mCent,Nintendo 3DS,Bolt,Other
2009,0,34.03,0,2.46,25.33,0,18.96,8.08,0.94,2.78,0,0,0,0,0,0,0,0.49,0,1.71,0,1.38,0,0,0,0,2.24,0,0,0,0,0,0,0,0,0,1.61
2010,0,25.37,0.95,9.09,23.9,0,16.24,16.23,0.22,3.51,0,0,0,0,0,0,0,1.04,0,0.68,0,0.36,0,0,0,0,0.7,0,0,0,0,0,0,0,0,0.46,1.25
2011,0,22.18,1.9,18.11,22.1,0,15.4,11.44,0.36,3.41,0.02,0,0.33,0,0.68,0,0,0.84,0,0.37,0,0.38,0.62,0,0.57,0,0.28,0,0,0,0,0,0,0,0.01,0.31,0.7
2012,0.35,23.9,7.88,23.95,20.11,0,10.58,4.83,0.66,3.64,0.33,0.03,0.41,0,1.17,0,0,0.6,0,0.12,0,0.14,0.33,0,0.37,0,0.16,0,0.04,0,0,0,0.03,0,0.14,0,0.23
2013,3.98,23.8,10.31,28.68,16.75,0,6.9,3.06,1.54,2.41,0.35,0.05,0.42,0,0.52,0.1,0,0.26,0,0.15,0,0.06,0.11,0,0.12,0,0.07,0,0.1,0,0,0,0.02,0,0.08,0,0.14
2014,21.25,23.03,10.31,23.1,11.06,0,4.03,1.52,2.29,1.41,0.41,0.1,0.46,0,0.25,0.12,0.02,0.07,0,0.13,0,0.08,0.05,0,0.05,0,0.01,0,0.06,0,0.04,0.05,0.01,0,0.02,0,0.08
2015,33.58,18.84,15.12,15.39,11.04,0,1.2,0.93,2.08,0.42,0.3,0.2,0.25,0,0.1,0.09,0.04,0.02,0.01,0.05,0,0.05,0.02,0,0.01,0,0,0.04,0.03,0,0.07,0.04,0.03,0,0.01,0,0.03
2016,38.38,17.92,17.56,7.33,10.15,5.36,0.25,0.59,1.42,0.17,0.08,0.09,0.16,0,0.04,0.1,0.05,0.01,0.11,0.02,0,0.04,0.01,0,0.01,0,0,0.03,0.01,0,0.03,0.02,0.04,0,0,0,0.01
2017,48.86,18.08,15.56,3.49,5.61,6.42,0.13,0.24,0.65,0.04,0.21,0.12,0.08,0,0.02,0.08,0.08,0,0.14,0.01,0,0.02,0,0,0,0,0,0.09,0.01,0,0.02,0.01,0.02,0,0,0,0
2018,54.17,18.77,12.31,1.98,4.78,5.46,0.08,0.09,0.33,0.02,0.43,0.36,0.06,0.64,0.01,0.14,0.1,0,0.1,0,0,0.01,0,0,0,0,0,0.03,0.01,0,0.01,0.01,0.01,0.08,0,0,0
2019,60.14,20.75,6.17,0.98,2.88,6.86,0.03,0.03,0.15,0.01,0.36,0.33,0.04,0.69,0,0.23,0.1,0,0.05,0,0.09,0,0,0,0,0,0,0,0,0,0,0.01,0,0.08,0,0,0
2020,62.5,24.05,3.21,0.36,1.71,6.49,0,0.01,0.04,0,0.45,0.39,0.04,0.15,0,0.22,0.12,0,0.09,0,0.13,0,0,0,0,0,0,0,0,0.01,0,0,0,0,0,0,0
2021,63.3,24.77,2.13,0.54,2,5.67,0,0.01,0.01,0,0.5,0.32,0.03,0.15,0,0.14,0.14,0,0.1,0,0.15,0,0,0,0,0.03,0,0,0,0.01,0,0,0,0,0,0,0.01
2022,64.39,24.76,1.44,0.72,1.77,4.86,0,0,0.01,0,0.49,0.27,0.04,0.1,0,0.14,0.12,0,0.01,0,0.13,0,0,0.56,0,0.13,0,0,0,0.05,0,0,0,0,0,0,0.01
2023,64.12,25.42,1.6,0.66,1.91,4.51,0,0,0.01,0,0.5,0.25,0.02,0.13,0,0.08,0.18,0,0.01,0,0.14,0,0,0.06,0,0.19,0,0,0,0.16,0,0,0,0,0,0,0.02
2024,65.93,23.68,1.54,0.38,2.08,4.31,0,0,0.01,0,0.52,0.45,0.03,0.12,0,0.03,0.21,0,0.01,0,0.15,0,0,0.06,0,0.36,0,0,0,0.11,0,0,0,0,0,0,0.04
Processing: Aggregation
Multiply market share with the number of internet users in the same year.
import : dsv ;; using https://github.com/artyom-poptsov/guile-dsv
         only (srfi :26) cut ;; allows for simpler mapping

;; browser market share has swapped axes; me must undo that
define : swap-axes table
  map : λ (n) : map (cut list-ref <> n) table
        iota : length : car table

;; read the the data
define : read-csv filename
  dsv->scm : open-input-file filename
           . #\, ;; delimiter: ,

define individuals-with-internet-table
  read-csv "itu-individuals-using-the-internet.csv"
define browser-market-share
  swap-axes
    read-csv "browser-ww-yearly-2009-2024.csv"

;; select the data
define : select-row name table
  map string->number
    and=> (assoc name table) cdr
;; internet users
define iwi-years : select-row "Year" individuals-with-internet-table
define iwi-world : select-row "World" individuals-with-internet-table
;; map from year to number of internet users
define iwi-year->world : map cons iwi-years iwi-world
;; browser market share data we’ll need
define bms-years : select-row "Year" browser-market-share
define bms-firefox : select-row "Firefox" browser-market-share
define bms-chrome : select-row "Chrome" browser-market-share
define bms-safari : select-row "Safari" browser-market-share

define : scale-by-total-internetusers year percentage
  and=> (assoc year iwi-year->world)
    λ (multiplier)
      list : number->string year
             number->string : * percentage (cdr multiplier) 0.01

define : marketshare->usercount marketshare
  filter : λ (x) x
    map scale-by-total-internetusers
      . bms-years marketshare

;; combine the data
define firefox-usercount
  marketshare->usercount bms-firefox
define safari-usercount
  marketshare->usercount bms-safari
define chrome-usercount
   marketshare->usercount bms-chrome

;; also output the world internet usercount for comparison
define population-worldinternet
  map
    λ (year-to-population)
      map number->string
        list (car year-to-population) (cdr year-to-population)
    . iwi-year->world
;; output the data
scm->dsv firefox-usercount (open-output-file "firefox-usercount-world.csv") #\space
scm->dsv chrome-usercount (open-output-file "chrome-usercount-world.csv") #\space
scm->dsv safari-usercount (open-output-file "safari-usercount-world.csv") #\space
display "Firefox Users\n"
scm->dsv firefox-usercount (current-output-port) #\space
display "\nChrome Users\n"
scm->dsv chrome-usercount (current-output-port) #\space
display "\nSafari Users\n"
scm->dsv safari-usercount (current-output-port) #\space
scm->dsv population-worldinternet (open-output-file "all-usercount-world.csv") #\space
display "\nInternet Users\n"
scm->dsv population-worldinternet (current-output-port) #\space
Firefox Users
2009 521.0359000000001
2010 601.2335
2011 575.8926
2012 507.7149
2013 424.01099999999997
2014 362.175
2015 310.4654
2016 256.3949
2017 213.1836
2018 194.2809
2019 188.2383
2020 193.48699999999997
2021 177.4162

Chrome Users
2009 55.7821
2010 197.10949999999997
2011 430.2346
2012 699.3910000000001
2013 888.2454000000001
2014 1070.85
2015 1325.4597999999999
2016 1578.9035999999999
2017 1858.3824
2018 2204.5848
2019 2607.7389000000003
2020 2961.91
2021 3158.6945

Safari Users
2009 58.89070000000001
2010 97.6633
2011 138.2664
2012 215.7848
2013 280.2828
2014 378.675
2015 385.7924
2016 428.18270000000007
2017 499.72440000000006
2018 538.0947
2019 653.2733999999999
2020 817.9639999999999
2021 926.289

Internet Users
2005 1023
2006 1147
2007 1367
2008 1545
2009 1727
2010 1981
2011 2174
2012 2387
2013 2562
2014 2750
2015 2954
2016 3217
2017 3444
2018 3729
2019 4119
2020 4585
2021 4901
Footnotes:
Keep in mind that this data is imperfect. It gives an indication of the market share and its changes, but it is not the one truth. As comparison: Netmarketshare gives a browser share of 1.77 to 3.62 % throughout 2021 while statcounter only gives 3.62%. A ground truth we have is the Public Data Report by Mozilla which shows 200 Million users — in line with statcounter but not so much with netmarketshare.