Publication with Frank Hase & Isamu Morino: Calculate Tokyo’s CO₂ Emissions directly from data
My paper with Frank Hase & Isamu Morino on Tokyo’s CO₂ Emissions is the July highlight of the SAT-group at KIT-IMK!

We published in Atmospheric Measurement Techniques:
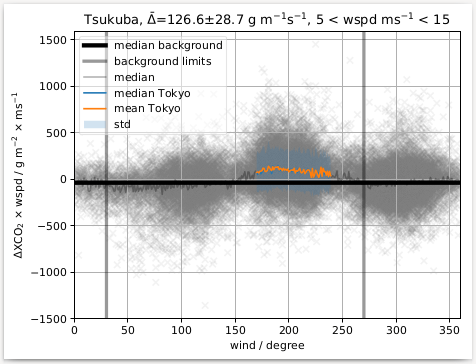
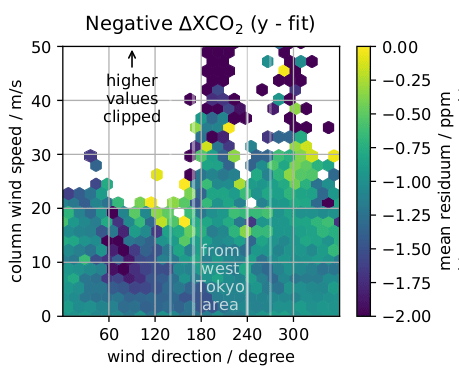
The manuscript shows that the yearly CO₂ emissions of Tokyo can be estimated using only 4 years of Total Carbon Column Observing Network (TCCON) data and radiosonde data. In the following image the sector of 170 to 240 degrees is associated with the Tokyo plume where elevated concentrations are found. You can see the emissions by eye:
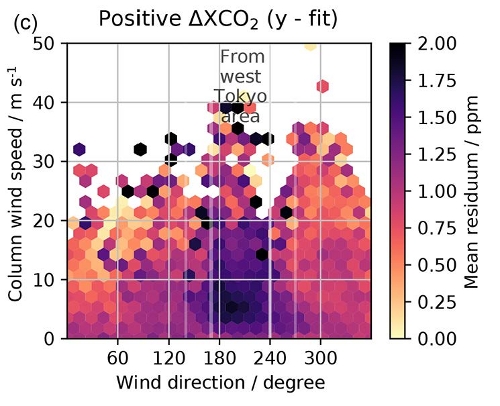
We separated the measured concentrations by wind direction and calculated the difference between wind received from Tokyo and wind received from background directions like the open ocean. This gives an estimate of the CO₂ emissions of Tokyo.
We estimate the average yearly carbon dioxide emissions from the area of Tokyo to be 70±21±6 MtC yr−1 between 2011 and 2016.
There’s one catch: We can measure only by day, because the TCCON site measures the absorption due to atmospheric CO₂ in direct sunlight. Since emissions by night are typically lower, the real emissions will be somewhat less than what we estimate, but there is no reliable data on that effect in Tokyo, therefore it’s not part of our results (but naturally noted as limitation in the paper).
The uncertainty can be reduced by using more complex methods, as for example done by the Global Carbon Project. The method we used however is so much simplified that it can be replicated by anyone with a laptop, a TCCON station in a good position near a megacity, and a standard site with meteorological sondes in the vicinity.
Having setup a full global transport model for the calculation of greenhouse gas emission and takeup during my PhD (see my PhD defense; posters are in English), I consider it hard to overstate how much this simplifies sanity-checking some of the data used in CO₂ emission trading.
Also we should put this precise ground-data to much more use — we can also see signatures in there that might match the nearby ecospheric drawdown, and these should really be checked:
Well, count on me to consider my work important; I would not have started it, if I didn’t consider it important. But it’s more than just that: its importance is why I finished the paper even though I’m no longer employed at KIT and therefore had to put in countless nights to finish the publication as a hobby.
For more precise data generated with much more complex methods, visit the Global Carbon Project.
If you doubt their data, use my code to check how well models match Tokyo. It’s available as Free Software from Zenodo: https://doi.org/10.5281/zenodo.3845548
When you do that, please read our publication first: https://www.atmos-meas-tech.net/13/2697/2020/amt-13-2697-2020.pdf
Took me two years, but it’s finished now!