Equal-Area Map Projections with Basemap and matplotlib/pylab
Plotting global equal area maps with python, matplotlib/pylab and Basemap.
Table of Contents
- 1. Problem
- 2. Map-Notes
- 3. Plotted
- 4. Other maps
- 5. Conclusing
- 6. Thank you!
- 7. Appendix: Supporting functions
1 Problem
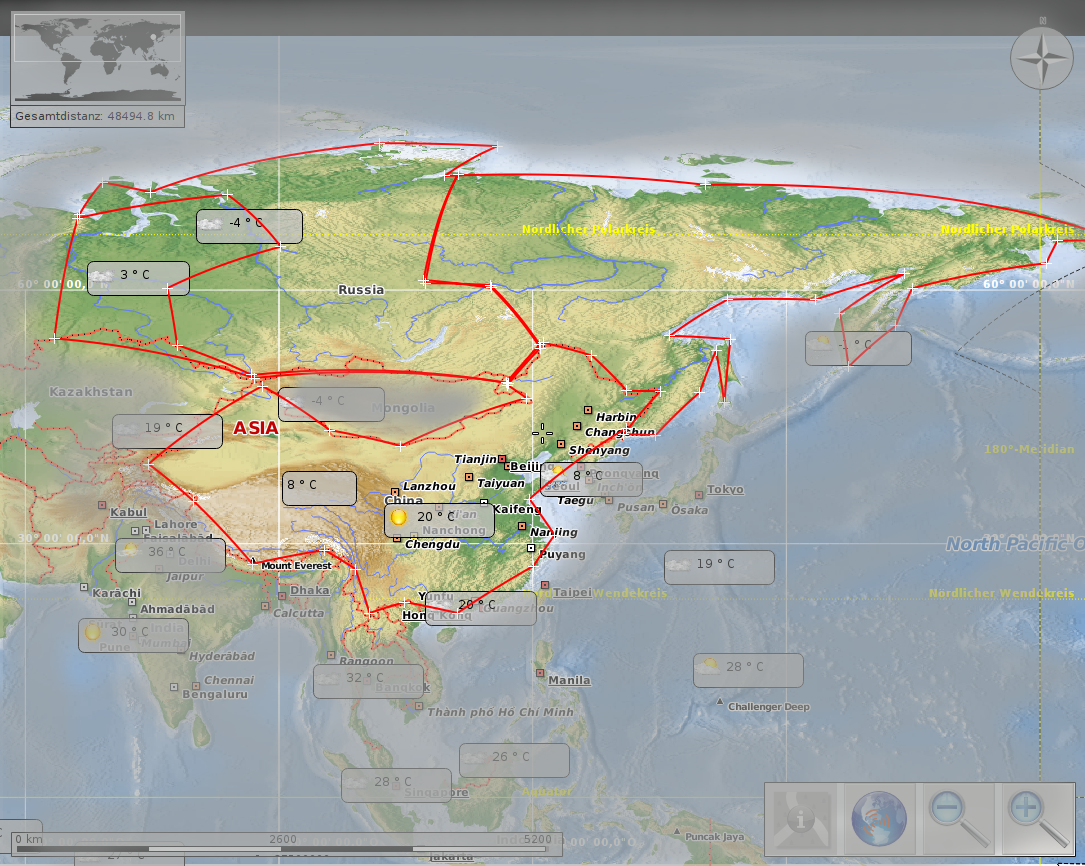
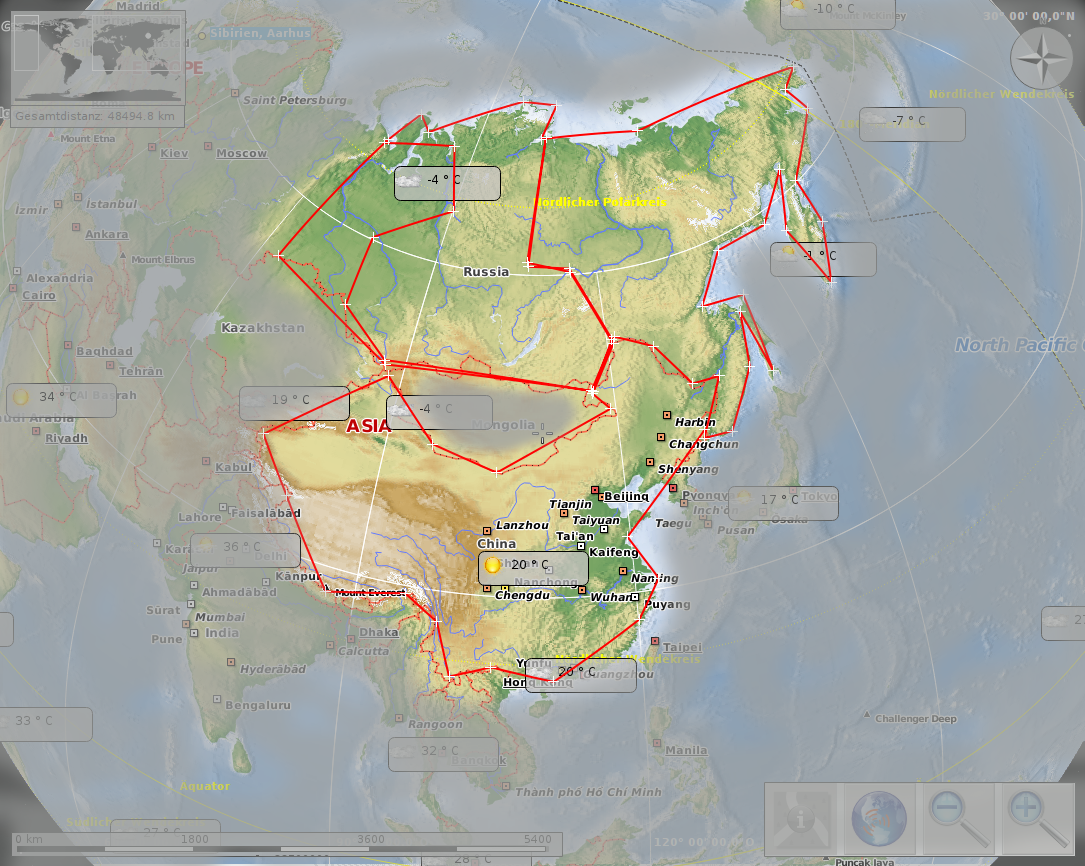
1.1 lat/lon pixels misrepresent areas
- Projected B_columns
- Simple Flat BMCOL B_block
- Globe BMCOL
- Simple Flat BMCOL B_block
- Note B_ignoreheading
Sibiria 13,1 · 106 km² vs. china 9.7 · 106 km²
Maps thanks to Marble Desktop Globe and Open Street Map, available under CC by-sa and Open Data Commons Open Database License (ODbL).
2 Map-Notes
2.1 Map Projections
- Maps B_columns
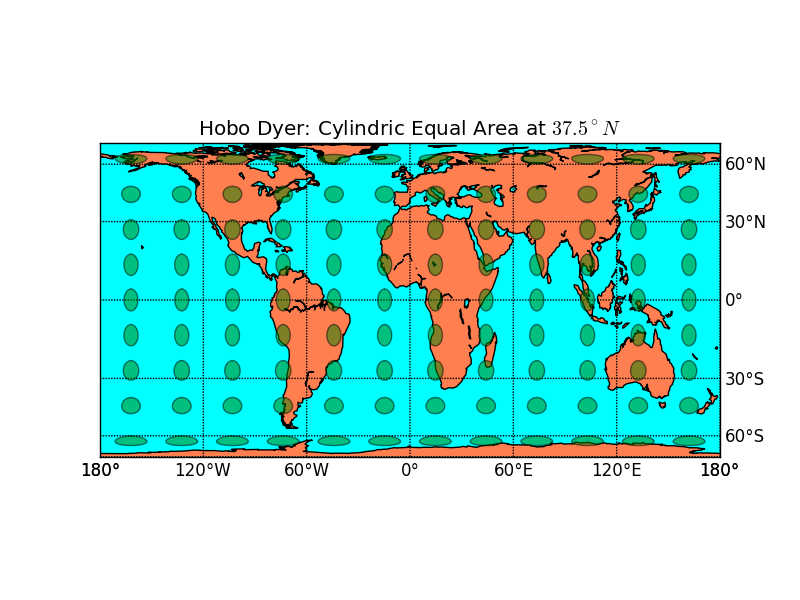
- Hobo-Dyer BMCOL B_block
- Rectangle
- equidistant longitude
- longitude/latitude over the Mediterranean Sea (more exactly: \(37.5^\circ\))
- Similar Maps: Gall-Peters (thinner), Lambert (wider)
- Basemap: equal area cylindrical (cea) with latts=37.5
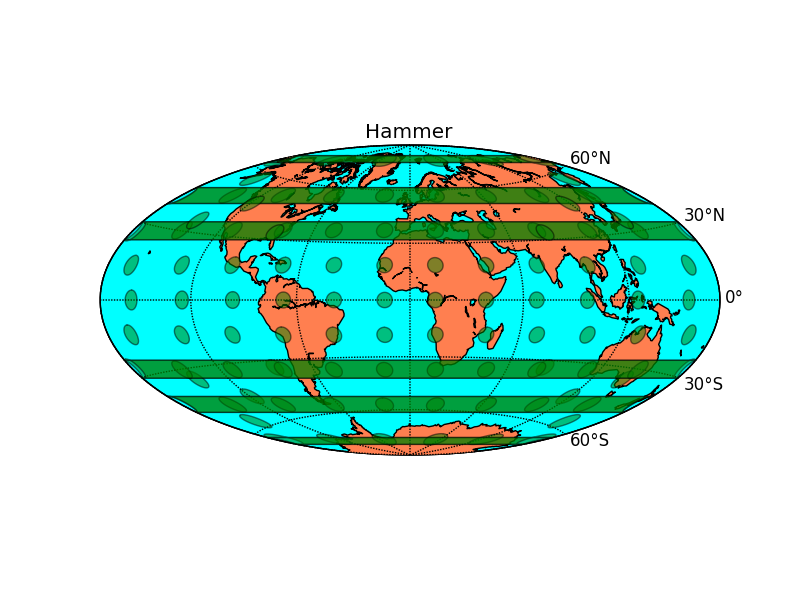
- Hammer BMCOL B_block
- Elliptic
- Low distortion at the poles
- 2:1 → 2 per page
- the earth appears round without making it hard to recognize patterns
- Similar Maps: Mollweide (more distorted at the poles, parallel latitudes)
- Basemap: hammer
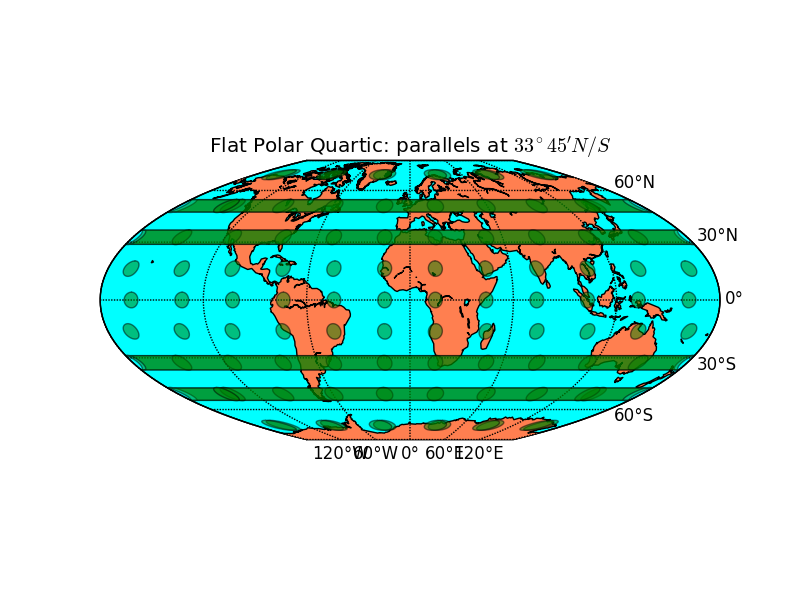
- Flat Polar Quartic B_block BMCOL
- Elliptic with polar cuts
- parallel latitudes
- Standard parallels at \(33^\circ 45' N/S\)
- poles are \(\frac{1}{3}\) the equator
- Similar: Eckart IV (poles are half the equator)
- Basemap: mbtfpq
- Hobo-Dyer BMCOL B_block
3 Plotted
3.1 Hobo-Dyer
m = map.Basemap(projection='cea', lat_ts=37.5)
outfile = "hobo-dyer.png"
pl.title("Hobo Dyer: Cylindric Equal Area at $37.5^\\circ N$")
3.2 Hammer
m = map.Basemap(projection='hammer', lon_0=0)
outfile = "hammer.png"
pl.title("Hammer") # latex-test: $\frac{1}{2}$
3.3 Flat Polar Quartic
m = map.Basemap(projection='mbtfpq', lon_0=0)
outfile = "flatpolarquartic.png"
pl.title("Flat Polar Quartic: parallels at $33^\\circ 45' N/S$")
4 Other maps
4.1 Other Equal Area map types
- Goode homolosine: Split, focus on land or ocean, straight latitude parallels, approximately preserve most shapes. Not available in matplotlib.
- Eckert IV: Like Flat Polar Quartic, parallels at 40° 30' N/S, poles are half the equator.
- Lambert cylindrical equal area: Like Hobo Dyer, very wide, shapes at the equator are correct.
- Gall Peters: Like Hobo Dyer, appears more distorted than Hobo-Dyer, shapes over europe correct (45°).
- Mollweide: Like Hammer with straight latitude parallels.
- Werner: It’s a heart :) - focus on a hemisphere without ignoring the rest. General case: Bonne.
- Tobler: General case leading to Lambert, Mollweide, Mollington and a few more — also see Tobler1973 after you manage to gnawl through the paywall…
- Collignon: Triangle, for cosmic microwave background.
5 Conclusing
5.1 Maps I plan to use
- Maps B_columns
- Hobo-Dyer BMCOL B_block
To show regional fluxes and longitudinally constrained regions: Easy to spot on rectangular grid.
- Hammer B_block BMCOL
To show a global overview: Helps the understanding of global data because it appears most similar to a real earth while including the whole earth surface.
- Flat Polar Quartic B_block BMCOL
For mainly latitudinally constrained regions: Straight latitudinal lines and high latitudinal resolution near the poles.
- Hobo-Dyer BMCOL B_block
6 Thank you!
6.1 Thank you for listening!
- Questions? B_block BMCOL
7 Appendix: Supporting functions
7.1 Basemap Imports
# basemap, pylab and numpy for plotting
import mpl_toolkits.basemap as map
import pylab as pl
import numpy as np
# netcdf for reading the emission files
import netCDF4 as nc
- Basemap: http://matplotlib.org/basemap/
- Pylab: http://www.scipy.org/PyLab
- Numpy: http://www.numpy.org/
- NetCDF: http://code.google.com/p/netcdf4-python/
7.2 Draw a map
<<addmapfeatures>>
<<addindicatrix>>
try:
  <<addemissions>>
  <<addcolorbar>>
except RuntimeError: # recover from missing fluxfile
  m.fillcontinents(color='coral',lake_color='aqua')
pl.savefig(outfile)
return "./" + outfile + ""
7.3 Map features
# add map lines
m.drawcoastlines()
# only fill continents if we do not plot emissions
# m.fillcontinents(color='coral',lake_color='aqua')
m.drawparallels(np.arange(-90.,120.,30.),
                labels=[False,True,True,False])
m.drawmeridians(np.arange(0.,420.,60.),
                labels=[True,False,False,True])
m.drawmapboundary(fill_color='aqua')
7.4 Tissots Indicatrix
# draw tissot's indicatrix to show distortion.
for y in np.linspace(m.ymax/20,19*m.ymax/20,9):
    for x in np.linspace(m.xmax/20,19*m.xmax/20,12):
        lon, lat = m(x,y,inverse=True)
        poly = m.tissot(lon,lat,4.0,100,
                        facecolor='green',
                        zorder=10,alpha=0.5)
7.5 Plot emissions
# d = nc.Dataset("/run/media/arne/3TiB/CTDAS-2013-03-07-2years-base-data/"
#                "analysis/data_flux1x1_weekly/flux_1x1.nc")
d = nc.Dataset("UNPUBLISHED")
biocovmean = np.mean(
    d.variables["bio_flux_prior_cov"][:,:,:], axis=0)
# projection: matplotlib.org/basemap/users/examples.html
lons, lats = pl.meshgrid(range(-180, 180),
                         range(-90, 90))
x, y = m(lons, lats)
# choose my standard color range: vmin = -0.5*vmax
vmax = max(abs(np.max(biocovmean)),
           2 * abs(np.min(biocovmean)))
vmin = -0.5*vmax
m.pcolor(x, y, biocovmean, shading='flat',
         vmin=vmin, vmax=vmax) # pcolormesh is faster
7.6 Nice colorbar
pl.rcParams.update({"text.usetex": True,
                    "text.latex.unicode": True})
colorbar = pl.colorbar(orientation="horizontal",
                       format="%.2g") # scientific
colorbar.set_label("$CO_{2}$ fluxes [$\\frac{mol}{m^2 s}$]")
| Anhang | Größe |
|---|---|
| flatpolarquartic.png | 127.57 KB |
| hobo-dyer.png | 139.26 KB |
| hammer.png | 138.15 KB |
| sibiria-china-flat.png | 1.14 MB |
| sibiria-china-globe.png | 1.14 MB |
| equal-area-map-projections.pdf | 3.06 MB |
| equal-area-map-projections.org | 10.19 KB |
- Druckversion
- Login to post comments
Use Node:
⚙ Babcom is trying to load the comments ⚙
This textbox will disappear when the comments have been loaded.
If the box below shows an error-page, you need to install Freenet with the Sone-Plugin or set the node-path to your freenet node and click the Reload Comments button (or return).
If you see something like Invalid key: java.net.MalformedURLException: There is no @ in that URI! (Sone/search.html), you need to setup Sone and the Web of Trust
If you had Javascript enabled, you would see comments for this page instead of the Sone page of the sites author.
Note: To make a comment which isn’t a reply visible to others here, include a link to this site somewhere in the text of your comment. It will then show up here. To ensure that I get notified of your comment, also include my Sone-ID.
Link to this site and my Sone ID: sone://6~ZDYdvAgMoUfG6M5Kwi7SQqyS-gTcyFeaNN1Pf3FvY
This spam-resistant comment-field is made with babcom.
Diese Seite nutzt Cookies. Und Bilder. Manchmal auch Text. Eins davon muss ich wohl erwähnen — sagen die meisten anderen, und ich habe grade keine Zeit, Rechtstexte dazu zu lesen…